A certificate arrives with a valve. It says the device is capable of SIL 3. Somewhere in a design review that becomes the sentence the loop is SIL 3, and the file closes.
It does not follow. A SIL rating belongs to a safety instrumented function, not to a device, and it is earned by three separate things at once. The random hardware failure arithmetic has to give a low enough probability of failure on demand. The architecture has to meet a minimum fault tolerance. And the systematic side, the design process, the software, the competence and the management of change, has to be adequate for the level being claimed. A certified component contributes to the first two and says almost nothing about the third.
The part that most often goes unexamined is that the arithmetic is not a statement about the equipment as installed. It is a statement about a maintenance regime that has not happened yet. Change the proof test interval and the same hardware moves between integrity levels without anyone touching it.
What the levels actually mean
For a function operating in low demand mode, which covers most process safety applications, the measure is average probability of failure on demand. Its reciprocal is the risk reduction factor, and that is usually the more intuitive number to argue about.
- average probability of failure on demand
- risk reduction factor required of the function
- frequency of the hazardous event without this function, per year
- tolerable frequency for the consequence, per year
- SIL 1. PFD avg from 1e-2 to 1e-1. Risk reduction factor 10 to 100.
- SIL 2. PFD avg from 1e-3 to 1e-2. Risk reduction factor 100 to 1000.
- SIL 3. PFD avg from 1e-4 to 1e-3. Risk reduction factor 1000 to 10000.
- SIL 4. PFD avg from 1e-5 to 1e-4. Risk reduction factor 10000 to 100000. Rare in the process industries, and normally a sign that the design should be changed instead.
Low demand mode applies when the function is called on less than once per year and less than twice the proof test frequency. Above that the function is in high demand or continuous mode and the measure changes to a dangerous failure rate per hour. Applying low demand equations to a function that is really being demanded regularly is one of the more common and least visible errors in a verification file.
The simplest case, and what it hides
For a single channel with no redundancy, the textbook result is that on average the function spends half a proof test interval in an undetected failed state.
- dangerous undetected failure rate, per hour
- dangerous detected failure rate, per hour
- proof test interval, hours
- mean time to restoration after a detected failure, hours
Read that first term carefully. The proof test interval is a linear multiplier on the result. Double it and the contribution doubles. This is the whole reason a SIL rating is a claim about maintenance. Nothing about the valve changes when the site moves from an annual test to a four yearly turnaround, but the number in the verification report does.
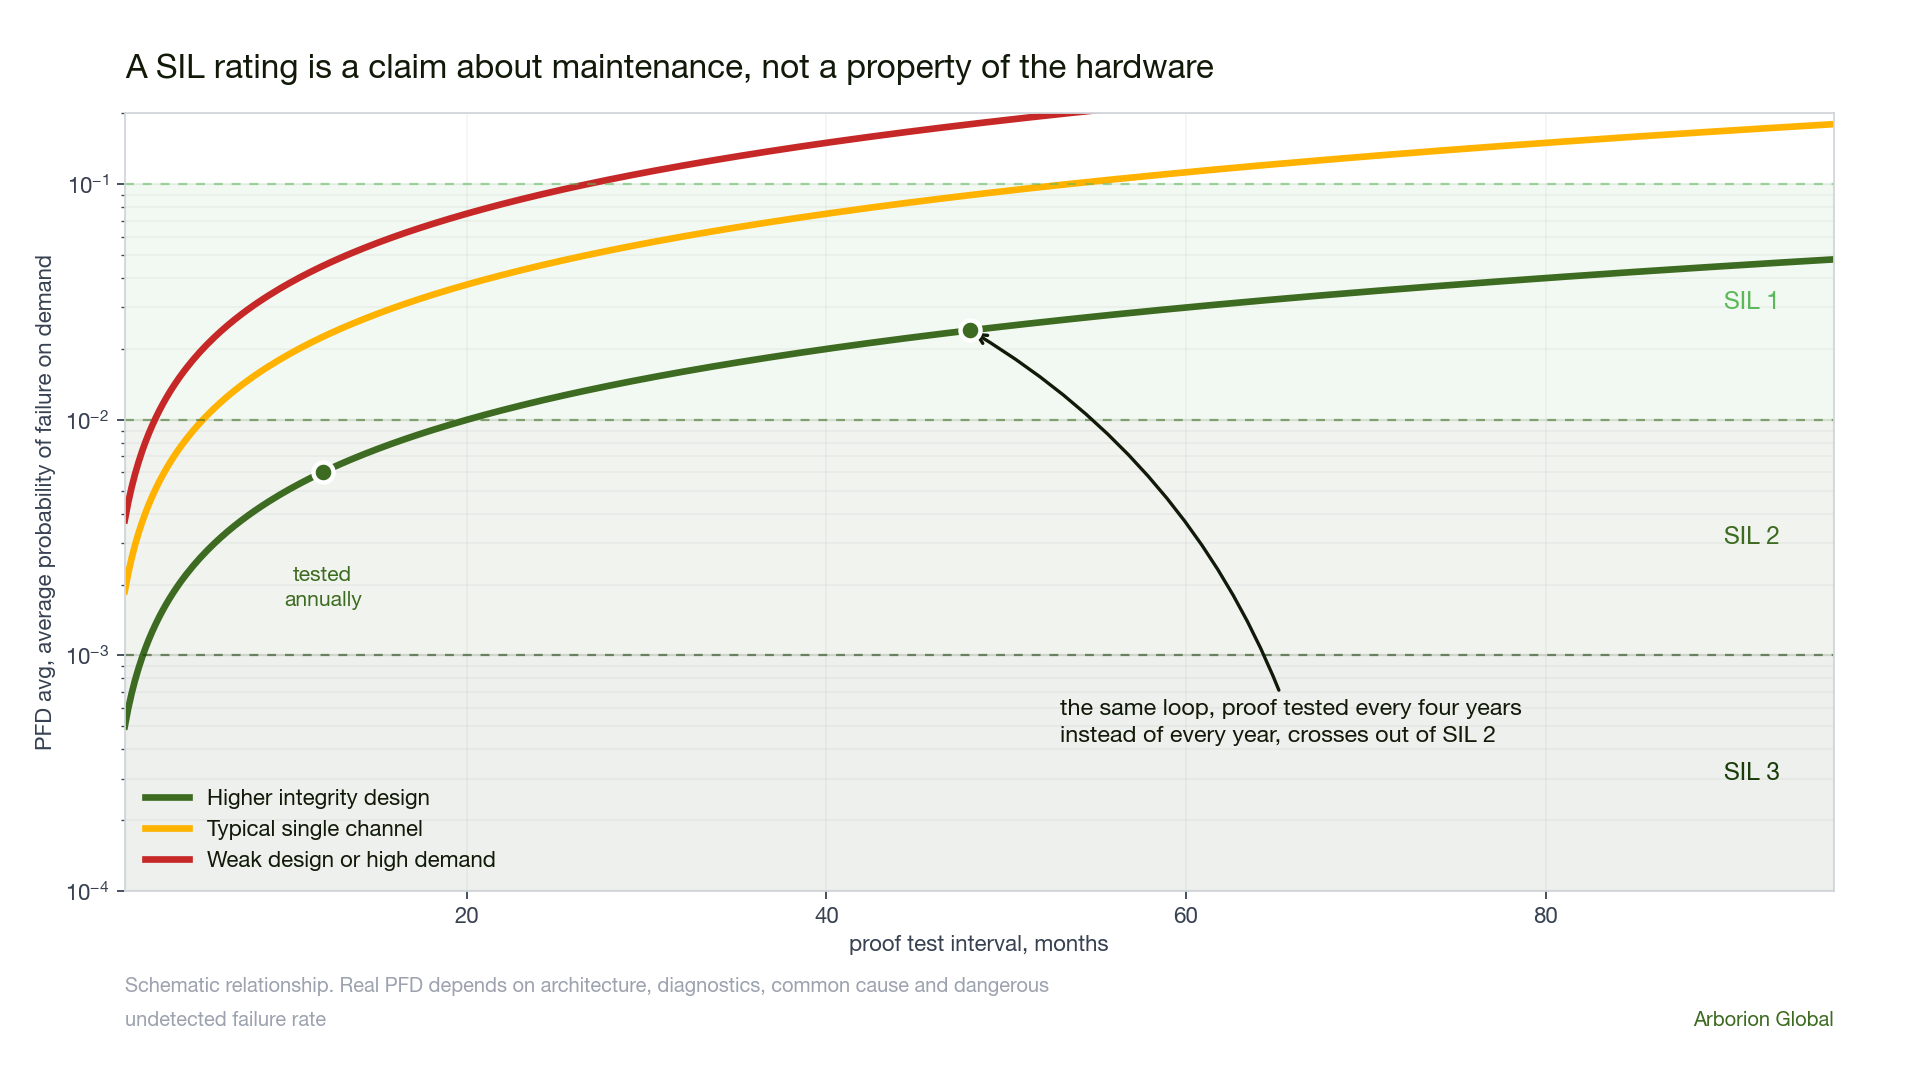
The linear form assumes a constant failure rate, so no wear out and no infant mortality, and it assumes the proof test is perfect and restores the function to as good as new. Both assumptions are convenient rather than true, and the second one is dealt with below.
The proof test that does not test everything
This is the assumption that quietly does the most damage. A proof test that strokes a valve from the control room confirms the solenoid, the actuator and the logic. It does not confirm that the seat will hold at process conditions, that the trim has not eroded, or that the valve will close against full differential pressure. Those failure modes survive the test and accumulate until the next overhaul.
Proof test coverage is the fraction of dangerous undetected failures the test would actually find. What escapes it is only cleared when the equipment is stripped down, which for most sites means the mission time.
- proof test coverage, fraction between 0 and 1
- proof test interval, hours
- mission time or interval between full overhauls, hours
Put that another way. Testing more often improves only the covered fraction. If the coverage is poor, shortening the interval has a ceiling, and past a certain point the only way to improve the function is a better test or better equipment. A verification that assumes perfect coverage will never reveal that ceiling, and the site will keep buying test frequency it cannot benefit from.
Redundancy, and the failure that defeats it
Adding a second channel helps, but not by the factor the independence assumption suggests. Two identical transmitters on the same tapping, in the same service, calibrated by the same technician on the same day, share failure mechanisms. The beta factor is the fraction of failures treated as common cause, and it puts a hard floor under what redundancy can achieve.
- common cause factor, typically 0.05 to 0.2 for process equipment
- dangerous undetected failure rate of one channel, per hour
- proof test interval, hours
That second term is the reason a 1oo2 arrangement built from two of the same device, mounted the same way and maintained by the same procedure, tends to plateau around a factor of ten to twenty better than a single channel rather than the hundreds the squared term alone would suggest. Diverse technology, separate process connections and staggered testing are what actually move beta, and none of them are free.
Staggered testing of redundant channels is worth more than it costs. Testing both transmitters in the same shift means a shared procedural error takes out both. Testing them months apart means the second channel is an independent check on the first.
The loop is the sum of its parts
A safety instrumented function is a sensor subsystem, a logic solver and a final element subsystem, and the probabilities add. In practice the final element dominates almost every loop, because a shutdown valve has a dangerous undetected failure rate an order of magnitude worse than a modern transmitter and a proof test that covers less of it.
- sensor subsystem including impulse lines and process connection
- logic solver, including input and output modules
- final element subsystem, solenoid, actuator and valve
The practical consequence is that money spent on a third transmitter usually buys very little, and money spent on a better valve, a partial stroke test or a diverse final element usually buys a great deal. The arithmetic tells you where to spend before anyone argues about it.
SIL verification calculator
Low demand PFD for a three subsystem loop, with imperfect proof testing and common cause.
What the equations cannot do
Two things constrain a design regardless of how good the calculated number is, and both are frequently treated as an afterthought.
The first is architectural constraints. IEC 61511 sets a minimum hardware fault tolerance for each integrity level based on the type of device, and no amount of favourable failure data lets you claim past it. A single channel of a complex device cannot support a high integrity claim even if the arithmetic says it can, because the arithmetic is only as good as the failure data behind it and the constraint exists precisely to limit how far that data is trusted.
The second is systematic capability. Random hardware failures are the ones the equations describe. Systematic failures, a specification that omitted a scenario, software that was never tested against the case that occurred, a bypass left in place after commissioning, an alarm rationalised away, are not in the model at all. They are managed by the safety lifecycle, and in the incident record they are far more common than random hardware failure.
Bypasses and overrides deserve their own attention. A function with an excellent calculated PFD that spends a fortnight of every year in bypass during startup has a real availability nothing in the verification file describes. If the bypass is not logged, time limited and alarmed, the number in the report is fiction.
When the protection existed and did not work
On 11 December 2005 tank 912 at the Buncefield oil storage depot in Hertfordshire was being filled with unleaded petrol overnight. The servo operated level gauge had stuck and stopped registering the rising level. That failure alone should not have mattered, because the tank had an independent high level switch whose whole purpose was to shut the inlet if the gauge was wrong.
The switch did not operate. Its design required a padlock to retain the test lever in the working position, and the padlock had not been fitted, so the switch sat in a state where it could not perform its function. Petrol overflowed for around forty minutes, a large vapour cloud formed and spread across the site, and shortly after six in the morning it ignited. The explosion injured 43 people and caused the largest fire in Europe since the Second World War.
Everything the arithmetic would have counted was present. There was a level measurement, and there was an independent high level trip. On paper the layers were there. What the paper did not capture was that the trip had never been proof tested in a way that would have revealed it was inoperable, and that the failure mode was not a random hardware failure at all. It was a design and maintenance interaction that no failure rate database contains.
This video is hosted by YouTube and loads only after you accept cookies.
Texas City and Buncefield are ten months apart and the instrumented failure is the same shape in both. A level indication that was believed, a protective device that existed and did not act, and a verification history that would have looked acceptable in a file. Neither was a case of the hardware being insufficiently reliable. Both were cases of the function not being what the paperwork said it was.
What a defensible verification contains
- A target that traces back to a specific hazard scenario and a stated tolerable frequency, not a level chosen because it seemed appropriate.
- Failure data with its source named, and a statement of whether it is generic, manufacturer supplied or from the site's own prior use record.
- The proof test interval used in the calculation, stated in the maintenance system, and matched to what the site can actually deliver rather than what makes the number work.
- An explicit proof test coverage, with the procedure written to achieve it, and the mission time that clears what the test does not.
- A common cause factor with a justification, and evidence of diversity or staggering if a low value has been claimed.
- Architectural constraint compliance shown separately from the probability calculation.
- The whole loop, including impulse lines, process connections, solenoids and the power and air supplies the function depends on.
IEC 61511 for the process sector safety lifecycle, including architectural constraints and prior use. IEC 61508 for the underlying framework and the reliability equations, with part 6 giving the simplified formulas used here. ISA TR84.00.02 for detailed SIL verification methods. IEC 61511 clause 16 for the operation and maintenance requirements that make a proof test interval binding rather than aspirational. The Buncefield Major Incident Investigation Board reports for the overfill sequence, and the US Chemical Safety Board report into BP Texas City.
Three questions worth asking today
- Does the proof test interval in the verification report match the interval in the maintenance system, and did anyone check after the last turnaround was rescheduled?
- What proof test coverage was assumed, and does the written test procedure actually achieve it?
- How many hours did each safety instrumented function spend in bypass last year, and does anybody know?
The third question is the one that most often has no answer. A function that cannot be shown to have been available is a function whose calculated probability of failure on demand describes something other than the plant you are running.