A quantitative risk assessment produces a number, and numbers are persuasive. A societal risk figure of two times ten to the minus five per year has a precision that tends to end the argument. It looks settled.
Underneath that number sit a dozen or so choices. Most are defensible in isolation. Several can move the result by an order of magnitude. This piece sets out the arithmetic, then the inputs that actually swing the answer, so that a study can be reviewed rather than simply accepted.
Individual risk, the arithmetic
Individual risk at a location is the sum over every scenario of the scenario frequency multiplied by the probability that a person at that location is killed if it happens.
- individual risk at a point, per year
- frequency of scenario i, per year
- probability of fatality at that point given scenario i
That figure assumes someone is present continuously. Individual risk per annum scales it by the fraction of the year the person is actually there, which is what makes it comparable to a tolerability criterion.
- individual risk per annum, per year
- hours per year the person is present
Occupancy is a legitimate correction and also a common place to quietly improve a result. If the assumed occupancy does not match the actual manning pattern, including maintenance campaigns and turnarounds, the IRPA is optimistic in a way that is difficult to see from the summary table.
Societal risk and the F N curve
Individual risk says nothing about whether an event harms one person or fifty. Societal risk does. The F N curve plots the cumulative frequency of events causing N or more fatalities against N, on log log axes.
- frequency of events with N or more fatalities, per year
- fatalities from scenario i
Tolerability is judged against a criterion line. The intercept sets how much risk is allowed at N equals one, and the slope sets how much harder large events are penalised.
- intercept, frequency allowed at N = 1
- slope, 1 is risk neutral and 2 is risk averse
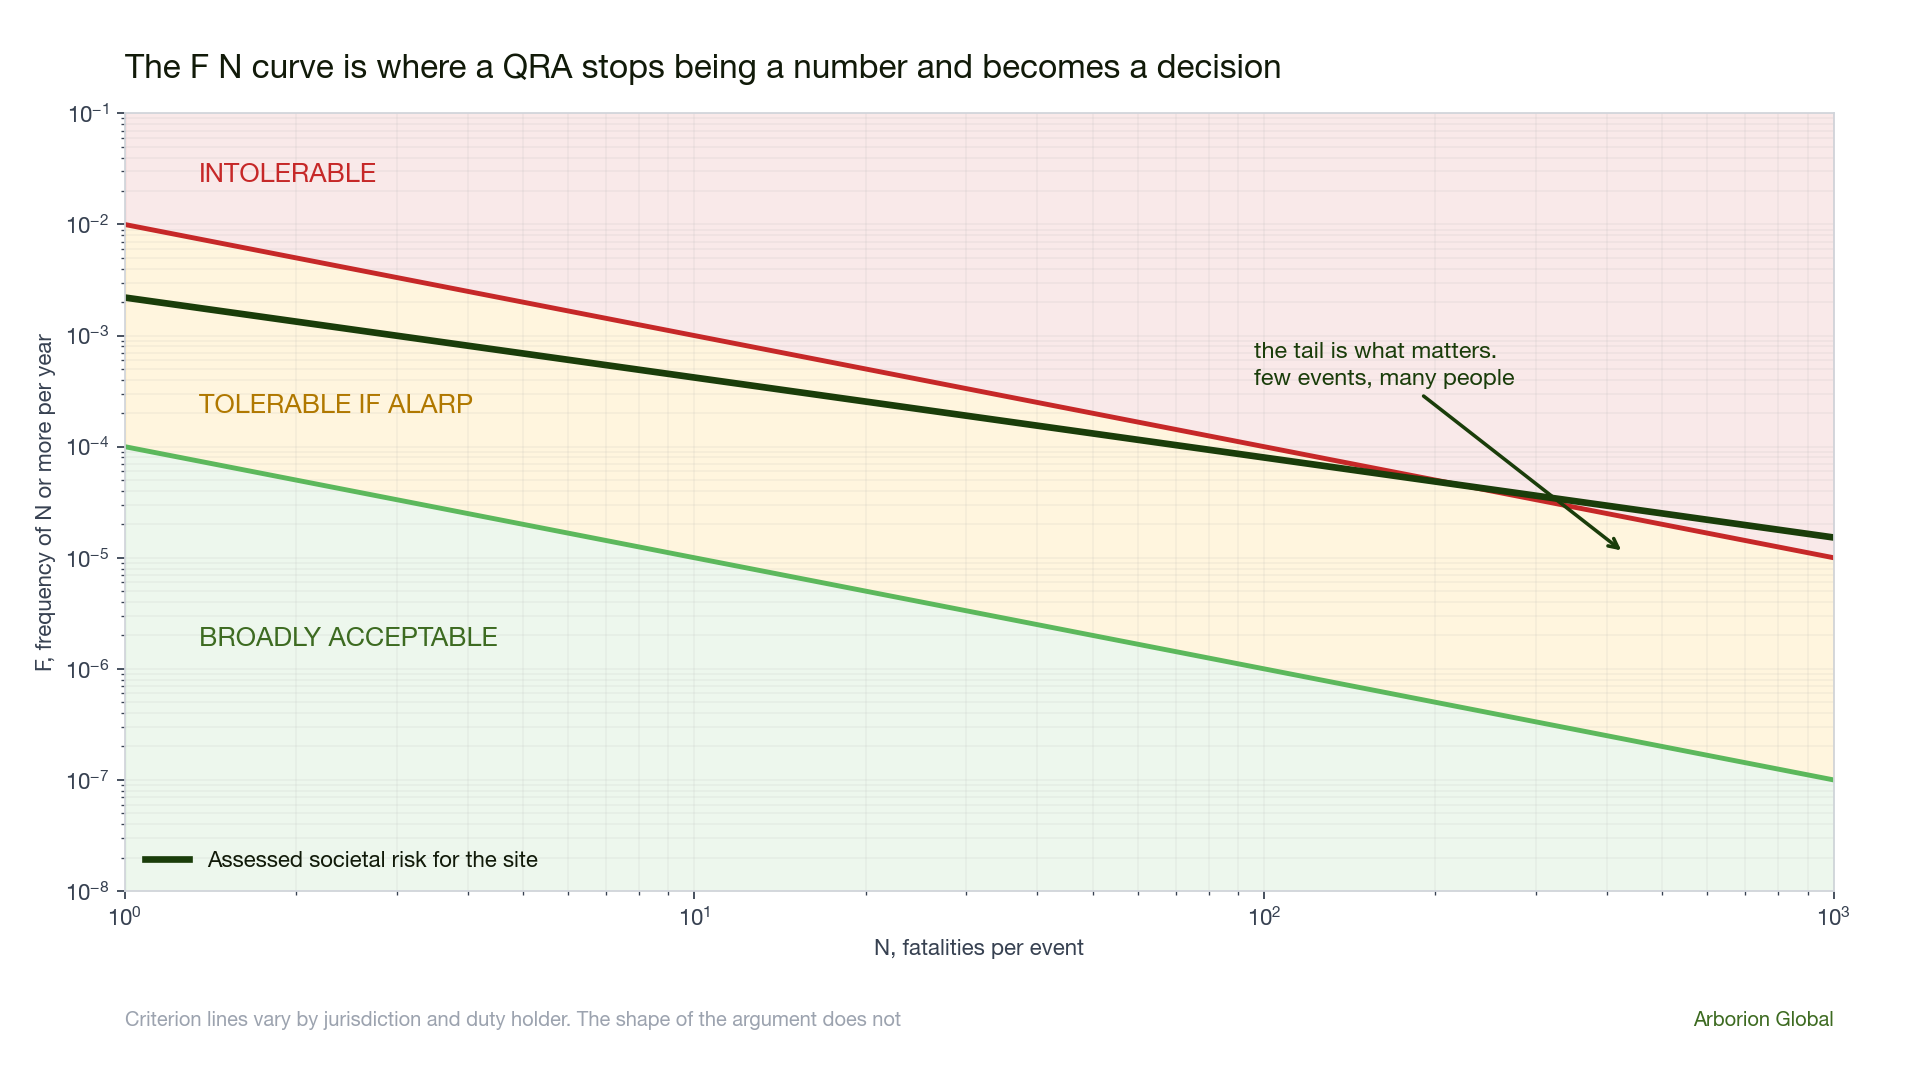
A site can show perfectly comfortable individual risk while carrying a societal risk tail that a regulator, an insurer or a community will find unacceptable. The two measures answer different questions and a study that reports only one is incomplete.
Try it on your own numbers
The calculator below runs both calculations. Enter your scenarios, set the occupancy and the criterion line, and it returns IRPA and the cumulative F N points with the breaches marked.
Individual and societal risk calculator
IRPA and the F N curve against your criterion line. Screening use only.
| Scenario | Frequency, /yr | Fatalities N | P fatality | |
|---|---|---|---|---|
| N or more | F, /yr | Criterion C/N^n | Result |
|---|---|---|---|
| 1 | 1.26e-3 | 1.00e-3 | breach |
| 5 | 2.60e-4 | 2.00e-4 | breach |
| 20 | 6.00e-5 | 5.00e-5 | breach |
| 80 | 1.00e-5 | 1.25e-5 | ok |
Where the answer actually comes from
The arithmetic above is trivial. Everything that matters happens upstream of it, in the frequencies and the fatality probabilities. Four inputs do most of the work.
Failure frequencies. Generic leak frequency data describes a population of equipment that is not yours. It averages across maintenance regimes, inspection quality, service severity and design vintages. Using generic data is reasonable. Using it without asking whether your asset sits above or below that average is not. A twenty five year old line in wet H2S service with a deferred inspection history does not deserve the same frequency as new pipework in clean service.
Weather. Dispersion results are dominated by atmospheric stability and wind speed. F class stability at two metres per second produces long, narrow, persistent clouds. D class at five produces something much shorter and better mixed. Same release, same hole size, hazard distances that differ by a large multiple. A defensible study uses a site specific weather distribution with sensible frequency weighting, not a single representative case chosen early and carried through everywhere.
Ignition probability. Whether a flammable release disperses harmlessly or becomes a vapour cloud explosion turns on this, models vary, and a factor of a few here propagates straight into the final number. Congestion deserves the same scrutiny, because explosion overpressure depends heavily on how obstructed the volume is, and a plot plan that has gained fifteen years of additional pipework and temporary structures is not the plot plan the original study assessed.
Vulnerability. The step from physical effect to probability of fatality is made with probit functions, which take the general form below.
- probit value, dimensionless
- dose or load. For thermal radiation, exposure time multiplied by intensity to the power four thirds
- constants for the effect and the population
- standard normal cumulative distribution
Probit constants vary between sources and between the populations they were fitted to. Take them from the reference the study cites, most commonly the TNO Green Book or the CCPS Guidelines for Chemical Process Quantitative Risk Analysis, and check that the same source is used consistently throughout. Mixing constants from different fits is a real and common error.
The failure mode that has nothing to do with mathematics
The most common way a QRA goes wrong is not technical. It is that the study was commissioned to confirm a decision already taken. Layout is frozen, the investment is committed, and the assessment is expected to demonstrate tolerability rather than test it.
You can usually spot it in the sensitivity analysis, or rather in its absence. A QRA without one is an assertion. One that shows how the result moves when ignition probability, weather weighting and leak frequency are varied across credible ranges is an argument, and an argument is what an ALARP demonstration actually requires.
What to ask for when reviewing a study
- The weather distribution used and how the categories were weighted
- The leak frequency source, and any site specific adjustment with its justification
- The ignition probability model and its basis
- The probit functions used and the single reference they came from
- A sensitivity analysis over the two or three dominant contributors
- Both individual and societal risk, with the criterion lines stated explicitly
- The occupancy assumptions, checked against the actual manning pattern
If a study cannot supply those, it has produced a number rather than an understanding. Be careful what you sign on the strength of it.